

Ep #60: Structured Logging: From Chaos to Clarity in Distributed Systems
Good logs tell stories. Great logs tell the truth

Breaking the complex System Design Components
By Amit Raghuvanshi | The Architect’s Notebook
🗓️ Nov 21, 2025 · Premium Post · Open to All ·
Why I Wrote This Post (and Why It Matters to You)
Over the past few months, while reviewing pull requests across multiple services, I noticed a recurring pattern:
developers writing logs like this 👇
_logger.LogError($”Exception during Order Service call for OidcScheme: {ex.Message}”);At first glance, nothing looks wrong.
But this single line quietly breaks one of the core principles of observability — structured logging.
Across services, I kept seeing teams interpolate strings, concatenate variables, or log entire objects without structure.
The result? Logs that look okay in a console but become impossible to query, correlate, or analyze once they reach production.
That’s why I wrote this post — to explain what structured logging really means,
why it’s worth adopting across every service, and
how a few good practices can turn your logs into powerful debugging and analytics tools.
⚠️ Caution: This is going to be a long post — but please bear with me.
By the end of it, you’ll know exactly how to log data properly — in a way that’s structured, searchable, and ready for real-world scale.It won’t teach you how to design a Kafka cluster, build an Uber-scale system, or architect a billion-user platform —
but it will help you reach a deeper level of understanding that every great system architect needs:
how to make your systems observable, explainable, and self-describing.
If you’ve ever been buried under hundreds of log lines during a production incident or chased a correlation ID through ten microservices, this post is written for you.
What Is Structured Logging?
Traditional logging treats logs as plain text. You might write something like this:
_logger.LogError($”Error processing order {orderId} for user {userId}”);That gives you something like:
Error processing order 1024 for user 888Seems fine — until you need to:
find all errors for
userId=888filter all logs by a specific
orderIdcorrelate this event across microservices
Your log viewer sees this as a blob of text. There’s no structure, no searchable fields, no metadata to help you slice and dice the data.
Now, let’s rewrite it using structured logging:
_logger.LogError(”Error processing order {OrderId} for user {UserId}”, orderId, userId);This simple change turns your log from text into data.
A structured log entry might look like this under the hood:
{
  “Timestamp”: “2025-10-21T08:33:12Z”,
  “Level”: “Error”,
  “MessageTemplate”: “Error processing order {OrderId} for user {UserId}”,
  “Properties”: {
    “OrderId”: 1024,
    “UserId”: 888
  }
}
Suddenly, you can query:
OrderId = 1024UserId = 888or even create dashboards for “top 10 users triggering errors”
Structured logs transform your text stream into queryable, analyzable, machine-readable events.
Here’s a quick TL;DR video summary of this article — perfect if you prefer watching instead of reading
Why Structured Logging Matters
Structured logging is more than a syntax style — it’s about observability at scale.
Let’s explore how it helps in real-world systems.
1. Searchability and Filtering
When your logs are structured, you can ask powerful questions like:
Show all failed payments with status=‘timeout’
Group errors by region or tenantId
Show trends of OrderFailed events in the last 24 hours
In plain-text logs, this would be nearly impossible without brittle regex searches.
In structured logs, it’s just a filter query.
2. Performance and Efficiency
Most logging frameworks (like Serilog, NLog, Microsoft.Extensions.Logging) defer string formatting when you use structured templates.
So instead of:
$”Error processing order {orderId}”—which gets formatted immediately—
structured templates like:
“Error processing order {OrderId}”are lazily evaluated only if the log level is enabled.
This saves unnecessary CPU and memory allocation, especially at high logging volumes.
3. Integration with Observability Tools
Structured logs are the backbone of platforms like:
Elastic Stack (ELK)
Seq
Splunk
Azure Application Insights
Datadog
Grafana Loki
These tools rely on structured fields ({UserId}, {OrderId}) to power their dashboards, alerts, and anomaly detection.
Without structure, your logs become static text — with structure, they become metrics, dimensions, and insights.
A Tale of Two Logs: Text vs Structured
Let’s imagine a payment service that handles transactions.
❌ Traditional Logging
_logger.LogError($”Payment failed for user {userId}. Amount: {amount}, Reason: {reason}”);Output:
Payment failed for user 101. Amount: 249.99, Reason: insufficient fundsTo find all payments with Reason = insufficient funds, you’d need to search raw text — and hope every developer spelled it the same way.
✅ Structured Logging
_logger.LogError(”Payment failed for user {UserId}. Amount: {Amount}, Reason: {Reason}”, userId, amount, reason);Now you can query:
Reason = “insufficient funds”and instantly get metrics, trends, and summaries.
This post was originally a premium, paid-only article. But I’ve seen even very experienced developers run into these mistakes, so I decided to make it freely available to everyone.
If you find posts like this valuable in your professional journey, please consider becoming a paid member. Your support helps me continue creating deep, practical breakdowns like this—explained in simple, clear terms.
System Design Perspective: Log Architecture Patterns
The Three-Tier Logging Architecture
In production systems, structured logging typically follows a three-tier architecture:
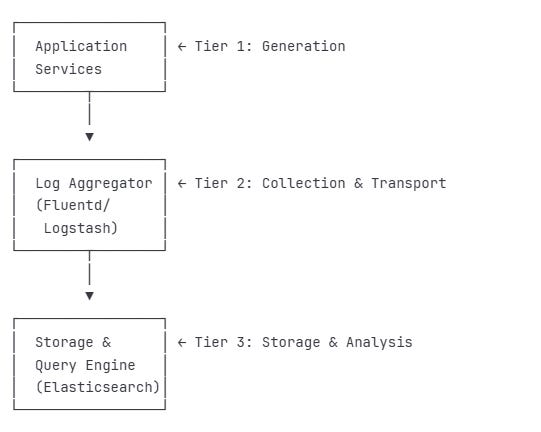
Tier 1: Generation Layer
Applications emit structured logs
Context enrichment happens here (request IDs, user IDs, trace IDs)
Local buffering for performance
Tier 2: Collection & Transport
Log shippers collect from multiple sources
Protocol normalization (syslog, JSON, etc.)
Filtering and routing logic
Backpressure handling
Tier 3: Storage & Analysis
Long-term storage with indexing
Query optimization for log analytics
Retention policies and archival
Real-time alerting and dashboards
Real-World System Examples
Stripe’s Payment Processing Logs
Stripe’s payment infrastructure relies on structured logging for compliance and debugging:
_logger.LogInformation(
    “Payment intent {PaymentIntentId} transitioned from {OldState} to {NewState}”,
    new {
        PaymentIntentId = “pi_123”,
        OldState = “requires_confirmation”,
        NewState = “processing”,
        Amount = 5000,
        Currency = “USD”,
        Customer = “cus_abc”,
        Merchant = “acct_xyz”,
        PaymentMethod = “pm_card_visa”,
        // Audit trail fields
        IpAddress = request.IpAddress,
        UserAgent = request.UserAgent,
        ApiVersion = “2024-11-01”,
        IdempotencyKey = request.IdempotencyKey
    });
👉 JSON logs are great until you accidentally log the entire HttpContext — then suddenly your 1 GB of free disk space becomes 0 GB of regret.
Why This Matters:
Compliance: Every state transition is traceable
Debugging: Can reconstruct exact payment flow
Analytics: Understand conversion rates by state
Fraud Detection: Patterns emerge from structured data
Advanced Patterns for Distributed Systems
Distributed systems, such as microservices architectures, introduce complexity in tracking, debugging, and monitoring user interactions across multiple services. Advanced logging patterns address these challenges by leveraging structured logging to provide traceability, business insights, and operational efficiency.
Pattern 1: Correlation IDs and Request Tracking
In distributed systems, a single user action often triggers a chain of requests across multiple services (e.g., API gateway, authentication service, order service). Without a unified way to track these interactions, debugging becomes nearly impossible. Correlation IDs solve this by assigning a unique identifier to each user request, which is propagated through all services involved in the request’s lifecycle. Logs across services include this identifier, enabling end-to-end tracing.
var correlationId = context.Request.Headers[”X-Correlation-ID”] .FirstOrDefault() ?? Guid.NewGuid().ToString();Now every log in the request pipeline automatically includes the correlation ID:
{
  “CorrelationId”: “abc-123-def”,
  “Service”: “api-gateway”,
  “Message”: “Request received”
}

{
  “CorrelationId”: “abc-123-def”,
  “Service”: “auth-service”,
  “Message”: “User authenticated”
}
Query by CorrelationId = “abc-123-def” and see the complete story.
Why It Matters
Traceability: A correlation ID ties together logs from disparate services, creating a cohesive narrative of a request’s journey. For example, a user’s checkout action can be traced from the front-end through payment and inventory services.
Debugging Efficiency: When an issue arises, querying logs by correlation ID reveals the exact sequence of events, pinpointing where failures occurred.
User Experience Insights: By tracking the full request path, teams can identify bottlenecks or services impacting performance.
Implementation Considerations
Generate or extract a correlation ID at the entry point (e.g., API gateway) and propagate it via HTTP headers or message metadata.
Ensure every service in the chain includes the correlation ID in its logs, typically as a structured property.
Use centralized log aggregation tools (e.g., ELK Stack, Splunk) to query logs by correlation ID for a unified view.
Handle edge cases, such as missing or duplicate IDs, by generating fallback IDs or validating inputs.
Enhancements
Nested Correlation: For complex workflows (e.g., a parent request spawning child requests), use hierarchical IDs to track sub-processes.
Cross-System Propagation: Extend correlation IDs to external systems (e.g., third-party APIs) by including them in outgoing requests.
Timeout Tracking: Pair correlation IDs with timestamps to detect requests that exceed expected durations.
When to Use
Microservices or distributed architectures with interdependent services.
Systems requiring end-to-end request tracing for debugging or compliance.
Environments with high request volumes where manual log correlation is impractical.
Pattern 2: Semantic Logging with Domain Events
Semantic logging shifts the focus from technical traces (e.g., “API call received”) to business-relevant events (e.g., “Order placed”).
public class OrderEventLogger
{
    public void LogOrderPlaced(Order order)
    {
        _logger.LogInformation(
            “OrderPlaced event”,
            new {
                EventType = “OrderPlaced”,
                OrderId = order.Id,
                CustomerId = order.CustomerId,
                TotalAmount = order.TotalAmount,
                ItemCount = order.Items.Count,
                PaymentMethod = order.PaymentMethod,
                ShippingAddress = order.ShippingAddress.ToLogSafeFormat(),
                Timestamp = DateTimeOffset.UtcNow
            });
    }
}
Why It Matters
Business Alignment: Logs reflect the language and concepts of the business domain, making them accessible to non-technical stakeholders like product managers.
Analytics Enablement: Structured domain events can be queried to derive metrics, such as conversion rates, average order value, or fulfillment times.
Event Sourcing Foundation: Semantic logs can serve as a lightweight event store, supporting event-driven architectures or auditing requirements.
Reduced Noise: Focusing on meaningful events eliminates low-value technical logs, improving clarity.
Implementation Considerations
Define domain events in collaboration with business stakeholders to ensure logs capture relevant attributes (e.g., for an “OrderShipped” event, include tracking number, carrier, and estimated delivery).
Use structured logging formats (e.g., JSON) to ensure machine-readability and queryability.
Standardize event naming and properties across services to enable consistent analytics.
Balance detail with volume: include only essential attributes to avoid bloating logs.
Enhancements
Event Versioning: Include version metadata to handle changes in event schemas over time.
Business Rule Validation: Log events only when business rules are satisfied (e.g., log “OrderPlaced” only for valid orders).
Real-Time Insights: Stream domain events to analytics platforms for immediate business reporting.
Cross-Domain Correlation: Link related events (e.g., “OrderPlaced” and “PaymentProcessed”) using shared identifiers.
When to Use
Systems with complex business processes requiring visibility into domain activities.
Organizations leveraging data-driven decision-making or event-sourcing patterns.
Teams needing to bridge technical logs with business outcomes.
Pattern 3: Log Enrichment Pipeline
Log enrichment involves automatically adding contextual metadata to logs at various stages of the request lifecycle. This metadata—such as environment details, user information, or infrastructure context—enhances logs without requiring developers to manually include it in every log statement. Enrichment occurs in a pipeline, typically at the application’s entry points or during log processing.
public class LogEnricherMiddleware
{
    public async Task InvokeAsync(HttpContext context)
    {
        // Enrich with deployment context
        using (LogContext.PushProperty(”Environment”, _environment.EnvironmentName))
        using (LogContext.PushProperty(”MachineName”, Environment.MachineName))
        using (LogContext.PushProperty(”AppVersion”, _appVersion))

        // Enrich with request context
        using (LogContext.PushProperty(”ClientIp”, context.Connection.RemoteIpAddress))
        using (LogContext.PushProperty(”UserAgent”, context.Request.Headers[”User-Agent”]))

        // Enrich with user context (if authenticated)
        using (LogContext.PushProperty(”UserId”, context.User?.Identity?.Name))
        using (LogContext.PushProperty(”TenantId”, context.User?.FindFirst(”tenant_id”)?.Value))
        {
            await _next(context);
        }
    }
}
Why It Matters
Consistency: Enrichment ensures all logs include critical context (e.g., user ID, application version) without developer intervention.
Debugging Efficiency: Contextual data like client IP, tenant ID, or machine name helps narrow down issues without cross-referencing external systems.
Scalability: Automated enrichment reduces the burden on developers, allowing them to focus on business logic.
Compliance and Auditing: Enriched logs provide a complete picture of who did what, when, and where, supporting regulatory requirements.
Implementation Considerations
Identify enrichment sources, such as HTTP headers (e.g., User-Agent), authentication tokens (e.g., user ID), or system metadata (e.g., environment name).
Apply enrichment early in the request pipeline (e.g., via middleware) to ensure all downstream logs inherit the context.
Use logging frameworks that support dynamic properties or scopes to propagate enrichment data.
Avoid over-enrichment, which can increase log volume or expose sensitive data (e.g., sanitize user inputs).
Enhancements
Dynamic Enrichment: Adjust enrichment based on request type or user role (e.g., add detailed context for admin users).
External Enrichment: Augment logs with data from external systems, such as geolocation derived from client IP.
Centralized Enrichment: Apply enrichment during log aggregation to add context unavailable at the application level (e.g., cluster node details).
Privacy Compliance: Mask or anonymize sensitive data (e.g., PII) during enrichment to meet GDPR or CCPA requirements.
When to Use
Systems with diverse logging needs across services or teams.
Multi-tenant applications requiring tenant-specific context.
Environments where logs support auditing, compliance, or detailed debugging.
Pattern 4: Structured Exception Logging
Exceptions in distributed systems contain critical diagnostic information, but unstructured exception logs (e.g., plain stack traces) are hard to query or analyze. Structured exception logging captures exceptions as structured data, including attributes like exception type, message, stack trace, error codes, and custom data. This approach makes exceptions machine-readable and actionable.
public static class ExceptionLoggingExtensions
{
    public static void LogStructuredException(
        this ILogger logger,
        Exception ex,
        string message,
        params object[] args)
    {
        var exceptionData = new
        {
            ExceptionType = ex.GetType().Name,
            ExceptionMessage = ex.Message,
            StackTrace = ex.StackTrace,
            InnerExceptionType = ex.InnerException?.GetType().Name,
            InnerExceptionMessage = ex.InnerException?.Message,
            HResult = ex.HResult,
            Source = ex.Source,
            TargetSite = ex.TargetSite?.Name,
            CustomData = ex.Data.Cast<DictionaryEntry>()
                           .ToDictionary(e => e.Key.ToString(), e => e.Value)
        };

        logger.LogError(ex, message + “ {ExceptionData}”,
                       args.Append(exceptionData).ToArray());
    }
}

// Usage
try
{
    await ProcessPayment(orderId);
}
catch (PaymentGatewayException ex)
{
    _logger.LogStructuredException(
        ex,
        “Payment processing failed for order {OrderId}”,
        orderId);
}
Why It Matters
Queryability: Structured exception data allows teams to filter and analyze errors by type, source, or impact.
Root Cause Analysis: Capturing details like inner exceptions or error codes helps identify underlying issues across services.
Proactive Monitoring: Structured logs enable alerting systems to detect recurring exceptions or error patterns.
Developer Productivity: Standardized exception logs reduce the time spent parsing unstructured stack traces.
Implementation Considerations
Capture a consistent set of exception attributes, such as type, message, stack trace, inner exceptions, and error codes.
Include contextual data relevant to the exception, such as the request or user triggering it.
Use structured logging formats to ensure exceptions are queryable in log aggregation tools.
Handle sensitive data carefully, avoiding logging confidential information (e.g., payment details) unless necessary.
Enhancements
Exception Categorization: Tag exceptions by severity or impact (e.g., critical vs. transient) to prioritize responses.
Correlation with Events: Link exceptions to domain events or correlation IDs to trace their business impact.
Custom Metadata: Allow developers to attach domain-specific data to exceptions (e.g., order ID for a payment failure).
Aggregation and Deduplication: Group similar exceptions in log analytics to reduce noise and identify trends.
When to Use
Systems where exceptions are frequent or critical to reliability.
Applications requiring detailed error analysis or automated alerting.
Distributed environments where errors may originate in downstream services.
Pattern 5: Performance Metrics Logging
Performance metrics logging embeds operational metrics—such as request latency, status codes, or resource usage—into structured logs. These logs serve dual purposes: they provide diagnostic information and act as a lightweight metrics system for monitoring system health and performance. By categorizing metrics (e.g., latency buckets, error flags), logs become a powerful tool for performance analysis.
Why It Matters
Unified Observability: Combining metrics with logs reduces the need for separate telemetry systems, simplifying infrastructure.
Granular Insights: Metrics like request duration or error rates can be queried by endpoint, service, or user to identify bottlenecks.
Trend Analysis: Structured metrics enable calculations like P95/P99 latencies or error rate trends over time.
Cost Efficiency: For smaller systems, log-based metrics avoid the overhead of dedicated metrics platforms.
Implementation Considerations
Log key performance indicators, such as request method, path, status code, duration, and response size.
Categorize metrics for easier analysis (e.g., flag slow requests or bucket latencies into “fast,” “medium,” or “slow”).
Ensure logs are lightweight to avoid performance overhead, focusing on high-value metrics.
Integrate with log aggregation tools to visualize metrics or trigger alerts based on thresholds.
Enhancements
Percentile Analysis: Aggregate logs to compute latency percentiles (e.g., P95) for performance benchmarking.
Error Correlation: Flag requests with errors or high latency to correlate performance with failures.
Dynamic Thresholds: Adjust performance thresholds based on service or time of day (e.g., stricter during peak hours).
Cross-Service Metrics: Combine metrics from multiple services using correlation IDs to analyze end-to-end performance.
When to Use
Systems needing lightweight performance monitoring without dedicated metrics infrastructure.
Applications with strict performance SLAs requiring detailed latency or error tracking.
Distributed systems where performance issues may span multiple services.
👉 Debugging production without structured logs is like trying to find your keys — in the ocean — at night — wearing mittens.
Common Mistakes to Avoid
❌ 1. Using String Interpolation or Concatenation
This is the most common anti-pattern:
_logger.LogError($”Exception during Order Service call: {ex.Message}”);Why it’s bad:
Loses structured data (
ex.Messagebecomes plain text)Eagerly formats even when not logged
Makes querying and analytics impossible
✅ Correct approach:
_logger.LogError(ex, “Exception during Order Service call: {ErrorMessage}”, ex.Message);❌ 2. Overlogging or Logging Too Verbosely
Structured logging gives you power — but don’t log every variable in sight.
Avoid:
_logger.LogInformation(”User {User} logged in with token {JwtToken}”, user, jwtToken);That token could expose sensitive data or personally identifiable information (PII).
👉 Remember: if you log passwords, you’re not debugging — you’re documenting a breach.
✅ Best Practice:
Redact or mask sensitive fields:
_logger.LogInformation(”User {UserId} logged in successfully”, user.Id);❌ 3. Using Inconsistent Field Names
Inconsistent property names break your analytics.
One developer might use {UserId}, another {UserID}, and a third {user_id} — and now your dashboards are useless.
✅ Best Practice:
Adopt standardized naming conventions (PascalCase or snake_case) across your codebase and enforce them via logging middleware or lint rules.
❌ 4. Logging Everything at Error Level
Some teams log everything as Error to “be safe.”
But this defeats the purpose of log levels — it floods your alerting system.
✅ Use proper log levels:
Trace– deep debuggingDebug– developer diagnosticsInformation– high-level app flowWarning– unexpected but recoverableError– failed operationsCritical– app or system failure
This helps your observability platform filter what truly matters.
❌ 5. Not Logging Enough Context
// Too little context
_logger.LogError(”Payment failed”);

// Better - includes context
_logger.LogError(
    “Payment failed for order {OrderId}, user {UserId}, reason {FailureReason}”,
    orderId, userId, failureReason);
❌ 6. Logging Large Objects Directly
// Bad - logs entire object, could be massive
_logger.LogInformation(”Processing request {Request}”, complexRequest);
// Good - log only relevant fields
_logger.LogInformation(
“Processing request {RequestId} for user {UserId}”,
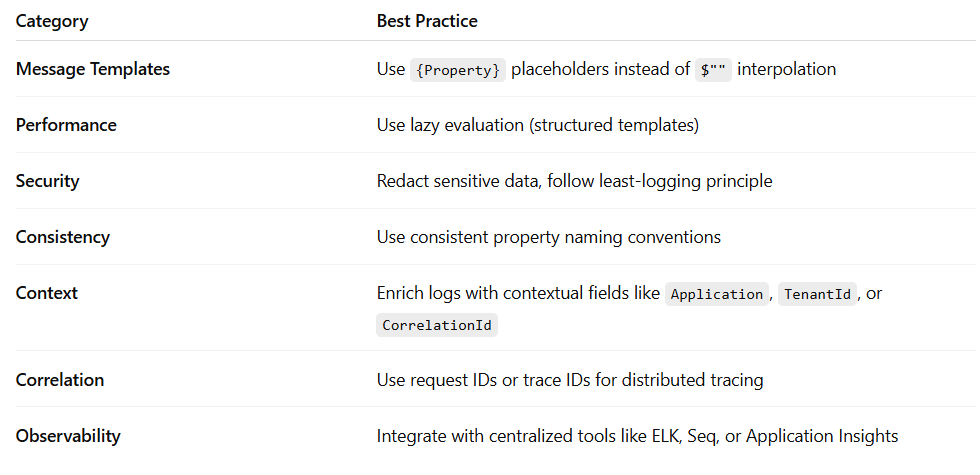
complexRequest.Id, complexRequest.UserId);Best Practices Summary
The Architect’s Take
Logging is not just about recording what happened — it’s about understanding why it happened.
Structured logging bridges that gap.
It gives architects visibility into the dynamic behavior of complex systems, enabling better root cause analysis, operational insights, and proactive alerting.
As systems scale, structured logs become as essential as metrics or traces.
They’re the connective tissue between code and observability — a form of truth you can analyze, visualize, and learn from.
So next time you write a log, don’t just write text.
Write data.
Because one day, your future self will be debugging a production issue at 3 AM — and structured logs will be the flashlight that guides you home.