

Ep #51: When Metrics Lie: How MegaMart’s Black Friday Crash Taught a Priceless Lesson
What happens when your monitoring tells you everything is fine — until it’s not

Breaking the complex System Design Components
By Amit Raghuvanshi | The Architect’s Notebook
🗓️ Oct 21, 2025 · Free Post ·
This post is an excerpt from my newly launched book, The System Design Trade-Offs Vol 3, where I break down complex technical concepts with real-world stories to make them easy to understand.
Imagine you’re running an online store, and Black Friday - the biggest sales day of the year - is coming. You’re expecting a flood of customers, but something goes wrong, and your website crashes. That’s exactly what happened to MegaMart, a mid-sized e-commerce company, until they learned the power of leading metrics.
In this post, we’ll dive into their story, explain what leading and lagging metrics are, and show how they can help you catch problems before they ruin everything.
The Story of MegaMart’s Black Friday Crash
The Company: MegaMart
MegaMart is an online retailer gearing up for Black Friday, their biggest sales day. They expected 10x their normal traffic - a huge opportunity, but also a massive challenge.
The Problem: Missing the Warning Signs
Before their big crash, MegaMart’s monitoring system wasn’t ready for the challenge. Here’s what they were tracking:
Lagging metrics: These show what already happened, like completed sales, revenue per hour, and customer complaints.
Leading metrics: These predict problems before they hit, but MegaMart only had basic ones, like CPU and memory usage (e.g., alert if CPU > 80%). They didn’t track critical details like database connection usage, queue sizes, or how fast their website was responding (request latency percentiles).
This setup was like driving a car with only a rearview mirror - you can see what’s behind you, but you’re blind to what’s coming.
What Happened on Black Friday
Here’s how the disaster unfolded:
11:00 AM: Traffic started climbing. Everything looked fine on the dashboards. Revenue was up; transactions were completing.
11:30 AM: Unknown to the team, database connection pools were at 95% capacity. The application was occasionally waiting for connections, but transactions were still completing, just slower.
11:45 AM: Connection pool hit 100%. New requests started timing out waiting for database connections. But the database CPU was only at 60%, so no alerts fired.
12:00 PM: Cascading failure:
Application threads filled up waiting for database connections
Load balancer health checks started failing
Servers were marked unhealthy and removed from rotation
Remaining servers got even more traffic
Within 10 minutes, the entire system collapsed
By 12:10 PM, the lagging metrics finally showed the disaster:
Transaction success rate: dropped from 95% to 20%.
Revenue: fell by 80%.
Customer support: Flooded with complaints
Site downtime: Complete outage for 45 minutes
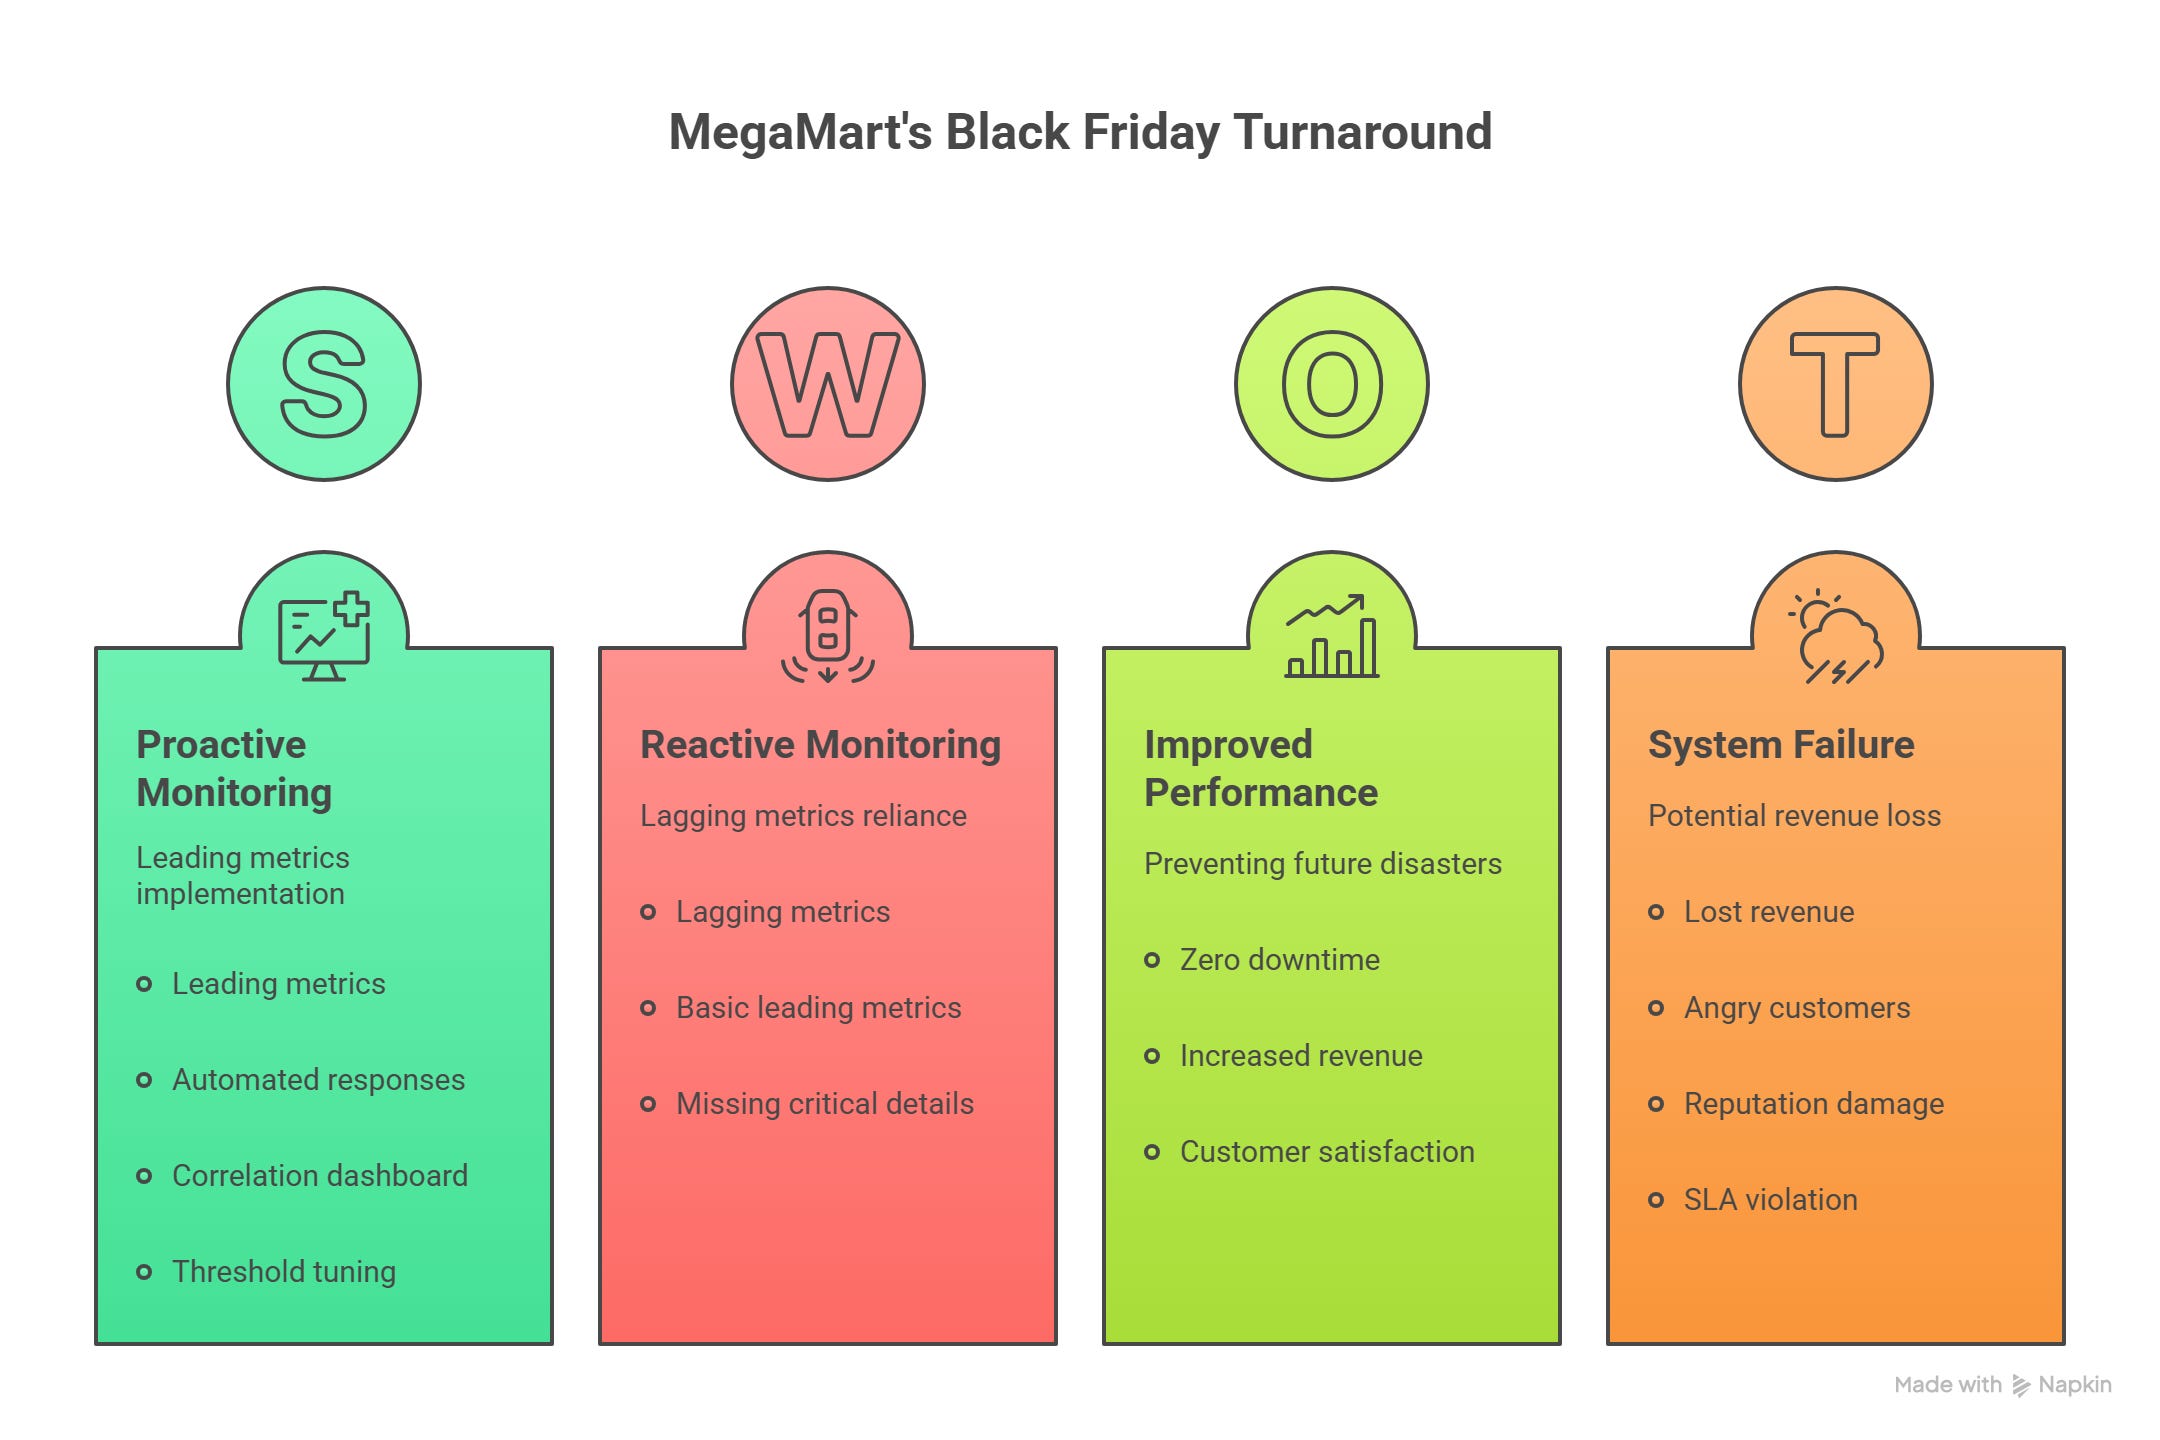
The Impact
Lost revenue: $2.3 million in just 45 minutes.
Angry customers: 50,000 abandoned shopping carts.
Reputation damage: MegaMart was trending online for all the wrong reasons - “Black Friday crash.”
SLA violation: They broke their promise of 99.9% uptime.
The Root Cause
MegaMart relied too much on lagging metrics (like sales and revenue) that only showed problems after they happened. They didn’t monitor leading metrics (like database connection usage or website response times) that could’ve warned them before the crash.
Now, before jumping into the solution, let’s first try to understand what are Leading and Lagging Metrics?
Here’s a quick TL;DR video summary of this article — perfect if you prefer watching instead of reading
What Are Leading and Lagging Metrics?
Let’s break it down simply:
Leading Metrics: Leading metrics are real-time measurements that indicate the current health and behavior of your system. They change before user-visible problems occur, giving you a window to take preventive action.
How they work:
Metrics are collected in real-time from systems (e.g., servers, applications, databases).
Thresholds or anomaly detection trigger alerts when metrics indicate trouble (e.g., CPU > 80%).
Teams or automated systems take action (e.g., scale servers, throttle traffic) to prevent issues.
Example: A spike in API latency (e.g., 500ms) signals a need to add servers before users notice slowdowns.
Common Leading Metrics
Infrastructure Level:
CPU utilization: When it reaches 80-90%, you know you’ll run out of capacity soon
Memory usage: Rising memory consumption can predict out-of-memory errors
Disk I/O wait time: High I/O wait indicates storage bottlenecks coming
Network throughput: Bandwidth saturation warns of connectivity issues
Connection pool exhaustion: When database connections are 90% used, you’re about to hit limits
Application Level:
Request latency (P50, P95, P99): Increasing latency predicts poor user experience
Error rate: Rising errors signal degrading service quality
Queue depth: Growing queues indicate processing can’t keep up with load
Thread pool utilization: Full thread pools mean requests will start failing
Cache hit ratio: Decreasing cache hits predict database overload
Database Level:
Query execution time: Slow queries predict database bottlenecks
Connection wait time: Threads waiting for connections signal capacity issues
Lock contention: Database locks predict transaction failures
Replication lag: Replica falling behind predicts stale read problems
Business Logic Level:
Requests per second (RPS): Traffic patterns predict capacity needs
Active user sessions: Growing sessions predict memory and resource needs
Processing time per transaction: Increasing processing time warns of performance issues
Lagging Metrics: Lagging metrics measure outcomes that have already occurred. They tell you what actually happened to users and the business after an issue occurred.
How they work:
Metrics are collected post-event, often from logs, user reports, or system outcomes.
Used to assess impact, validate service level objectives (SLOs), or analyze trends.
Example: A report of 10% failed checkouts indicates a payment system issue after it affected users.
Common Lagging Metrics
User Impact Metrics:
Downtime duration: How long was the service unavailable?
Failed requests: How many user requests failed?
User-reported errors: How many support tickets were filed?
Affected users: How many people experienced the problem?
Session failures: How many user sessions were interrupted?
Business Impact Metrics:
Lost revenue: How much money was lost during the outage?
SLA breaches: Did we violate our service level agreement?
User churn: Did users leave because of the issue?
Reputation damage: What was the social media/press impact?
Failed transactions: How many purchases or operations failed?
Operational Metrics:
Mean Time to Detect (MTTD): How long until we noticed the problem?
Mean Time to Resolve (MTTR): How long to fix it?
Incident count: How many incidents occurred this month?
Postmortem findings: Root causes identified after the fact
The Difference: Leading metrics help you prevent disasters; lagging metrics help you measure them. Think of leading metrics as a weather forecast (it might rain, bring an umbrella) and lagging metrics as a rain gauge (it rained 2 inches).
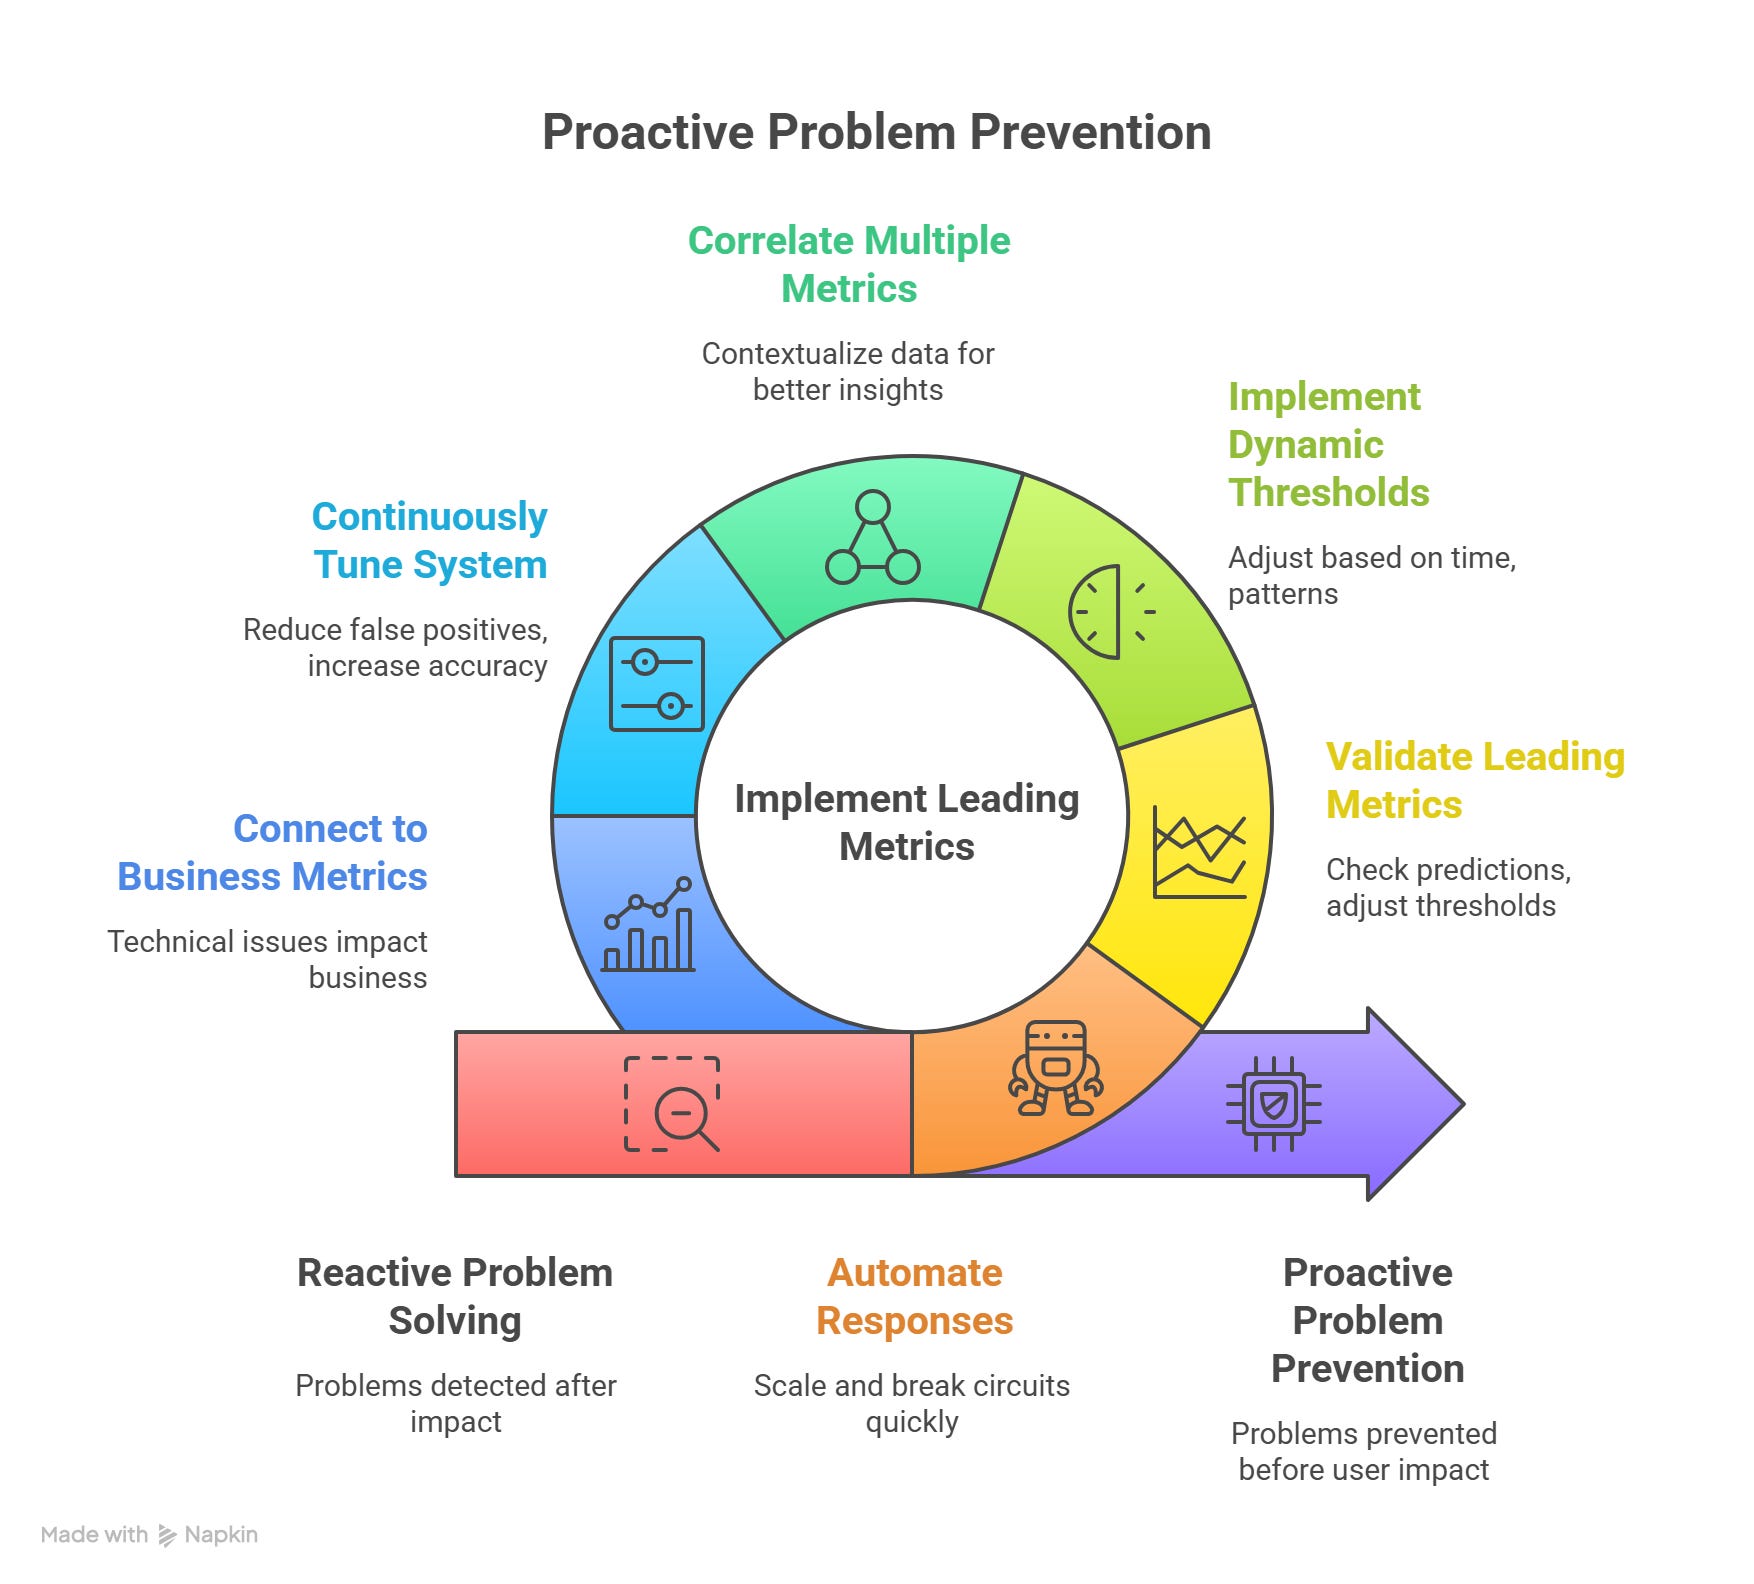
How MegaMart Fixed It
After the Black Friday disaster, MegaMart’s architects got to work. Here’s how they turned things around with leading metrics:
Phase 1: Adding Leading Metrics (implemented in 2 weeks)
They started tracking critical warning signs:
Database connection pool usage: Alert at 85% utilization.
Website response time (P99): Alert if P99 > 500ms (i.e. if 99% of requests take >500ms).
Queue depth: Alert if more than 1000 orders are waiting (i.e. if message queues exceed 1000 items).
Thread pool usage: Alert at 80% utilization.
Error rate: Alert if errors exceed 0.5%.
Active sessions: Track how many users are on the site to predict load.
Phase 2: Automating Responses (implemented in 1 month)
They set up systems to act automatically when leading metrics signaled trouble:
Connection pool at 85%? Add more database read replicas.
Response time >500ms? Turn on aggressive caching and pause non-critical tasks.
Queue depth >1000? Add more background workers.
Error rate >0.5%? Use circuit breakers to stop non-critical traffic.
Phase 3: Building a Correlation Dashboard (implemented in 2 months)
They created a dashboard to connect the dots:
Top section: Real-time leading metrics (latency, connection pools, CPU).
Bottom section: Lagging metrics (sales success rate, revenue, errors).
Time-aligned to show how leading metrics predict lagging outcomes.
Phase 4: Threshold tuning using historical data (ongoing)
They analyzed past incidents to make alerts smarter:
Switched to anomaly detection instead of fixed thresholds (e.g., alert if response time is 2x higher than normal).
Set different thresholds for peak hours (like Black Friday) vs. quiet times.
Reduced false alerts by studying which warnings actually led to problems.
The Next Black Friday: A Success Story
The next Black Friday, MegaMart handled the same 10x traffic with no issues. Here’s what happened:
Timeline:
11:15 AM: Leading metric alert: “Database connection pool at 87%”
Automated response: Scaled read replicas from 3 to 8.
Human response: Team acknowledged, monitored
Lagging impact: None
Result: No slowdown for customers.
12:30 PM: Leading metric alert: “P99 latency 520ms (normally 200ms)”
Automated response: Activated aggressive caching, paused non-critical tasks (e.g. sending emails).
Human response: Engineers found and fixed slow database queries.
Lagging impact: Tiny 0.1% error rate, no customer complaints.
2:00 PM: Leading metric alert: “Queue depth 1100 (normally 200)”
Automatic response: Scaled background workers from 10 to 25.
Human response: Team checked processing rates.
Lagging impact: Orders processed smoothly.
The Results
Zero downtime: 100% uptime.
Revenue: $12 million (5x the previous Black Friday).
Customer satisfaction: 98% positive ratings.
SLA performance: 99.99% uptime achieved.
Key Lessons Learned
Leading metrics prevent disasters; lagging metrics measure them: Before the fix, they only knew about problems after customers were affected. After adding leading metrics, they prevented problems before users noticed.
Automate responses to leading metrics: Humans are too slow. Automated scaling and circuit breakers fixed issues in seconds.
Use lagging metrics to validate leading ones: They checked if leading metric alerts actually predicted real problems, then adjusted thresholds to reduce false alarms.
Static thresholds don’t work: “CPU > 80%” is meaningless. 80% CPU at 2 AM is a problem; 80% CPU during Black Friday is normal. They implemented dynamic thresholds based on time of day and historical patterns.
Context is everything: A single metric in isolation is useless. Connection pool at 85% might be fine if request latency is normal, but it’s critical if latency is spiking. They learned to correlate multiple metrics.
Keep tuning: Their first implementation had too many false positives (30 alerts per day, only 2 real issues). They spent months tuning thresholds, reducing noise to 3-5 alerts per day with 80% being real issues.
Technical metrics ARE business metrics: Every technical issue eventually shows up as a business problem. Monitor the technical leading indicators to prevent business lagging indicator degradation.
Takeaways for You
MegaMart’s story isn’t just about e-commerce - it’s about foresight.
Whether you’re building a startup, scaling a SaaS platform, or maintaining critical services, the same principle applies:
You can’t manage what you can’t see ahead of time.
Leading metrics are your early warning system — they give you a chance to fix problems before your users ever notice.
Lagging metrics, on the other hand, help you learn, improve, and validate that your systems and processes actually work.
Use both.
Use them wisely.
And most importantly, build systems that learn faster than they fail.
Closing Note
If you enjoy posts like this, you’ll probably love The System Design Trade-Offs Vol 3.
It’s written in the same storytelling style - no jargon, just practical lessons.
The book covers topics like:
One Big Transaction vs. Many Small Transactions: Balancing reliability and scalability.
HTTP/1.1 vs. HTTP/2/gRPC: Choosing the right protocol for your app.
Leading vs. Lagging Metrics: Using the right metrics to stay ahead of problems.
API Versioning: URI vs. Header: Keeping your APIs user-friendly as they evolve.
File-based vs. Object Storage: Picking the best storage for your needs.
Graph Databases vs. Relational Databases: When to use each for connected data.
These stories and lessons will help you understand system design trade-offs and make better decisions in real-world scenarios.
Want to dive deeper? Grab
The System Design Trade-Offs Vol 3 (as a standalone book),
The Architect’s Complete Collection (at a special Diwali discount: 25% off for Premium Monthly Members/ 50% off for Premium Yearly Members/Completely Free for Premium Lifetime Members - Ping me to get the discount code or check your email or 15% off for everyone else offer valid until October 23, 2025).
very well explained